
To concisely see the key indicators of your business without scrolling through dozens of pages of reports or Excel tables, the dashboard is a tool you cannot do without.
Shopify sales dashboard by Mipler is a great alternative that we offer for your consideration. Check out the product by following the link.
To have a clearer understanding of the types of reports you can create in Shopify, check out the Shopify reports analysis article.
So, what are we going to talk about? What is a dashboard, and why does your store need one? We will also consider examples of dashboards for Shopify and explain why the Shopify sales dashboard by Mipler is the best choice for your store.
What is a dashboard?
The dashboard is where the critical data is presented.
This data is often presented in tables, graphs, charts, metrics, and other means of visual display of information.
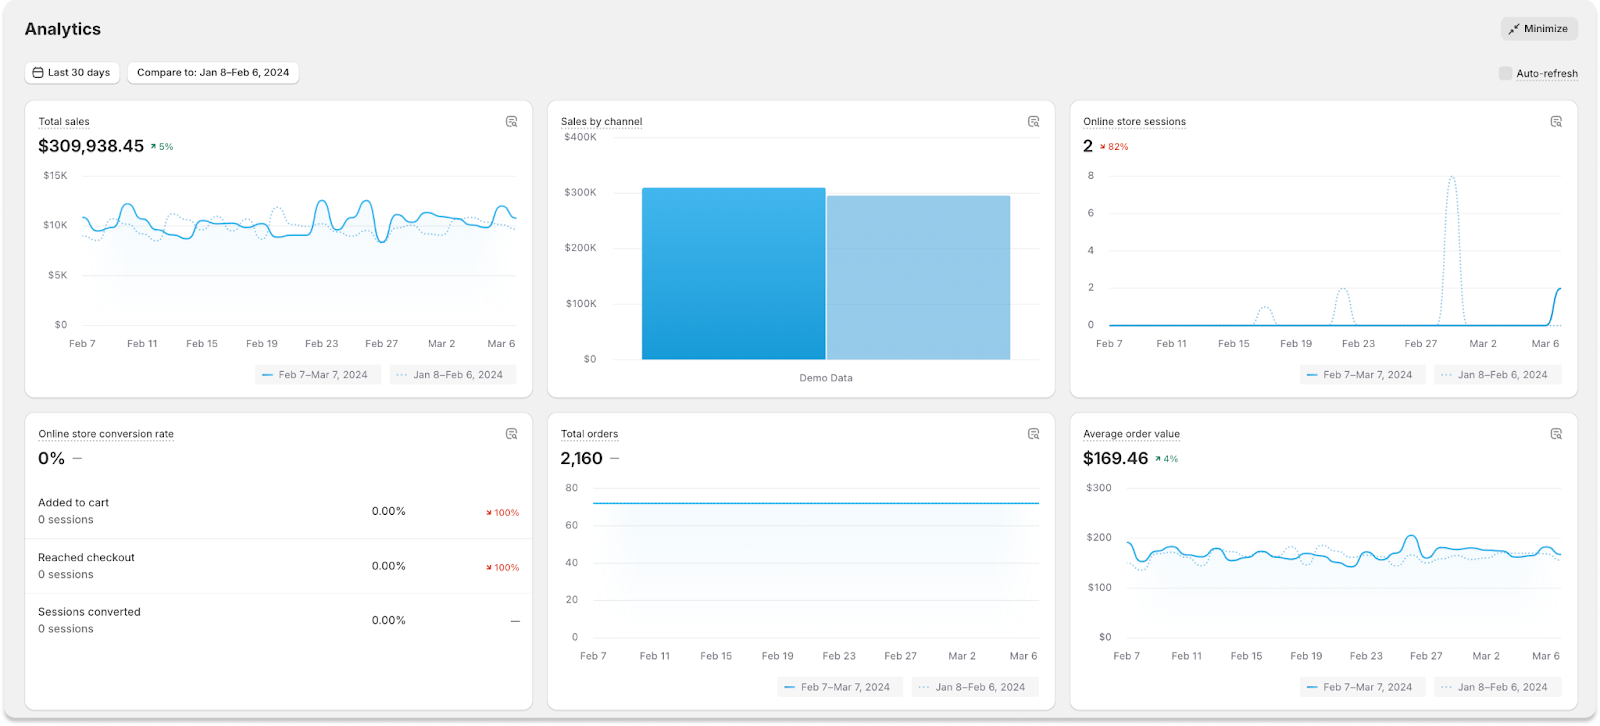
The dashboard allows you to receive and analyze data in real-time. With its visual data, the dashboard helps the owner or manager better understand what is happening in their business and react to events promptly.
The primary purpose of creating a dashboard is to ensure a person’s comprehensibility of a large amount of information. Usually, we talk about the visualization of dynamic databases, which are no longer so convenient and visual.
What data can be analyzed using dashboards?
- Typical transaction value
- Rate of profit return
- Rate of conversions
- Cart abandonment rate
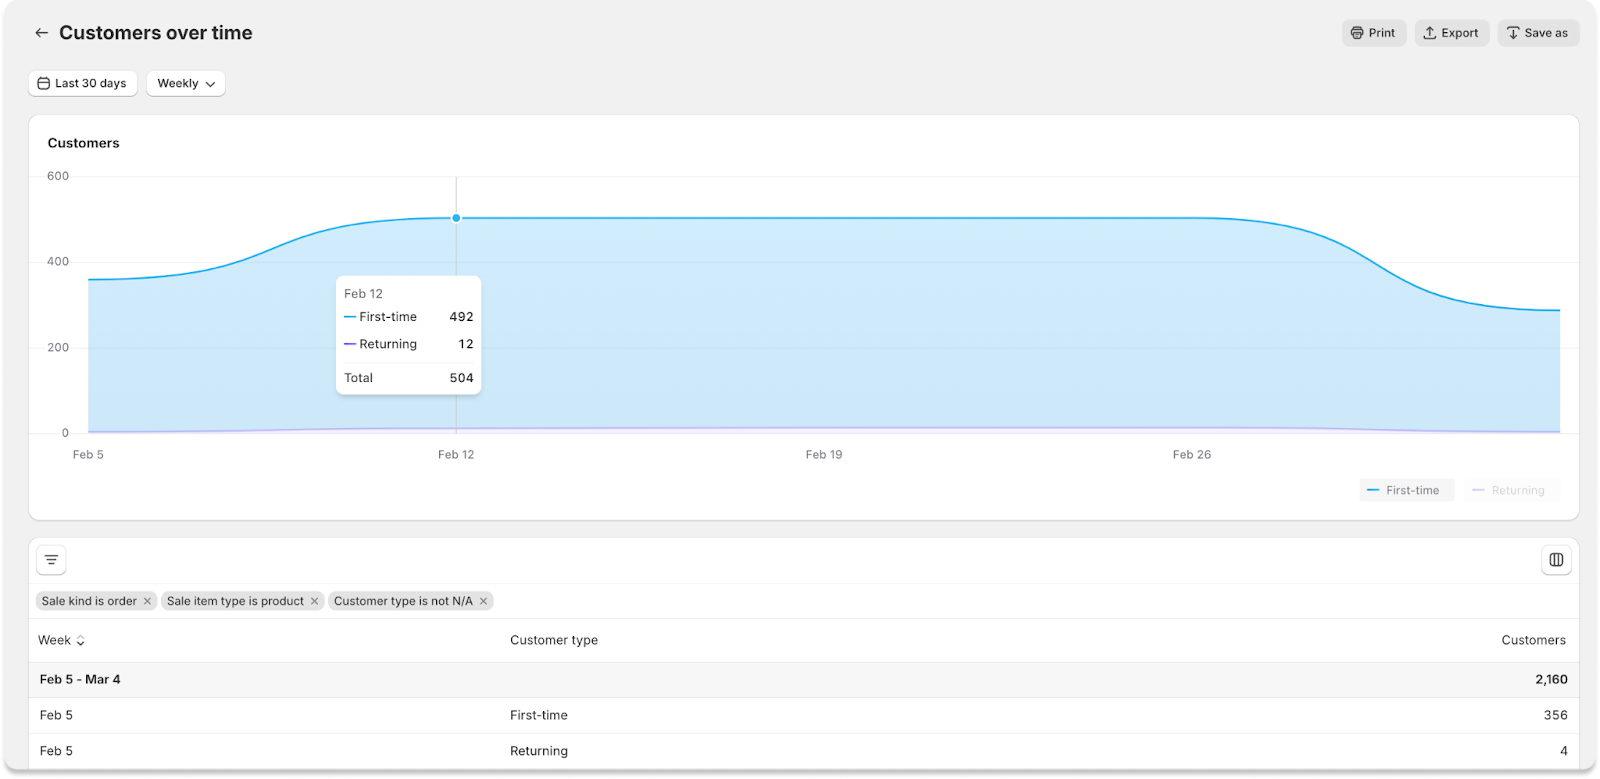
- Orders from first-time customers vs. repeat purchases
- Expenses on sold products
- Cost to attract a customer
- Value of a customer over time and other metrics.
Advantages of Implementing a Sales Dashboard
- Data visualization. Dashboards transform data into a graphical form, facilitating their perception and analysis.
- Quick access to critical information. All necessary data and indicators are combined on one screen, providing quick access to critical information.
- Real time. Some dashboards offer real-time updates, allowing you to track events and changes instantly.
- Easy to identify trends. With graphs and charts, dashboards make it easy to identify and understand trends in your business.
- Interactivity. Many dashboards allow you to interact with data, filter it, and get detailed information.
- Troubleshooting. Identifying and tracking problems helps to solve them in time.
- Effective resource management. Detailed analysis of indicators allows you to effectively allocate resources and focus on critical aspects of the business.
- Systematization of data. Collecting and organizing different data types in one place makes interpreting and comparing them easier.
- Simplification of decision-making. Dashboards provide a clear picture of the situation, which facilitates the process of making informed decisions.
- Flexibility of setting. Many dashboards can be customized to specific user needs.
Sales Dashboard Examples
Seasonal analysis of sales performance.
The online store uses a dashboard to compare sales in different seasons. This helps determine which items are popular at a given time. Such information is essential for optimizing inventory and advertising campaigns.
Customer segmentation and personalization.
The store uses a dashboard to segment customers based on their purchases and preferences. Such analysis allows you to create personalized offers, attracting more customers and increasing conversion.
Abandoned cart recovery efforts.
A retail store uses a dashboard to track abandoned carts. This allows you to send personalized offers or reminders to convince customers to complete a purchase.
Optimization of delivery and logistics.
A home goods company uses a dashboard to monitor delivery times and costs. This helps to choose optimal delivery options for different regions, increasing customer satisfaction.
Product returns and feedback analysis.
Analyzing feedback helps improve the quality of services and reduce the number of returns by investigating problems and finding solutions.
Tracking social media and marketing campaigns.
The store uses a dashboard to study the impact of advertising campaigns on social networks. This helps to refine strategies according to successful channels and content.
Website traffic and user behavior statistics.
The company uses a dashboard to analyze traffic and user behavior. It helps to optimize the website, improving navigation and attracting more customers.
Inventory turnover and inventory levels.
An online retailer uses a dashboard to track turnover and inventory levels. This helps to maintain optimal inventory levels and avoid unnecessary costs.
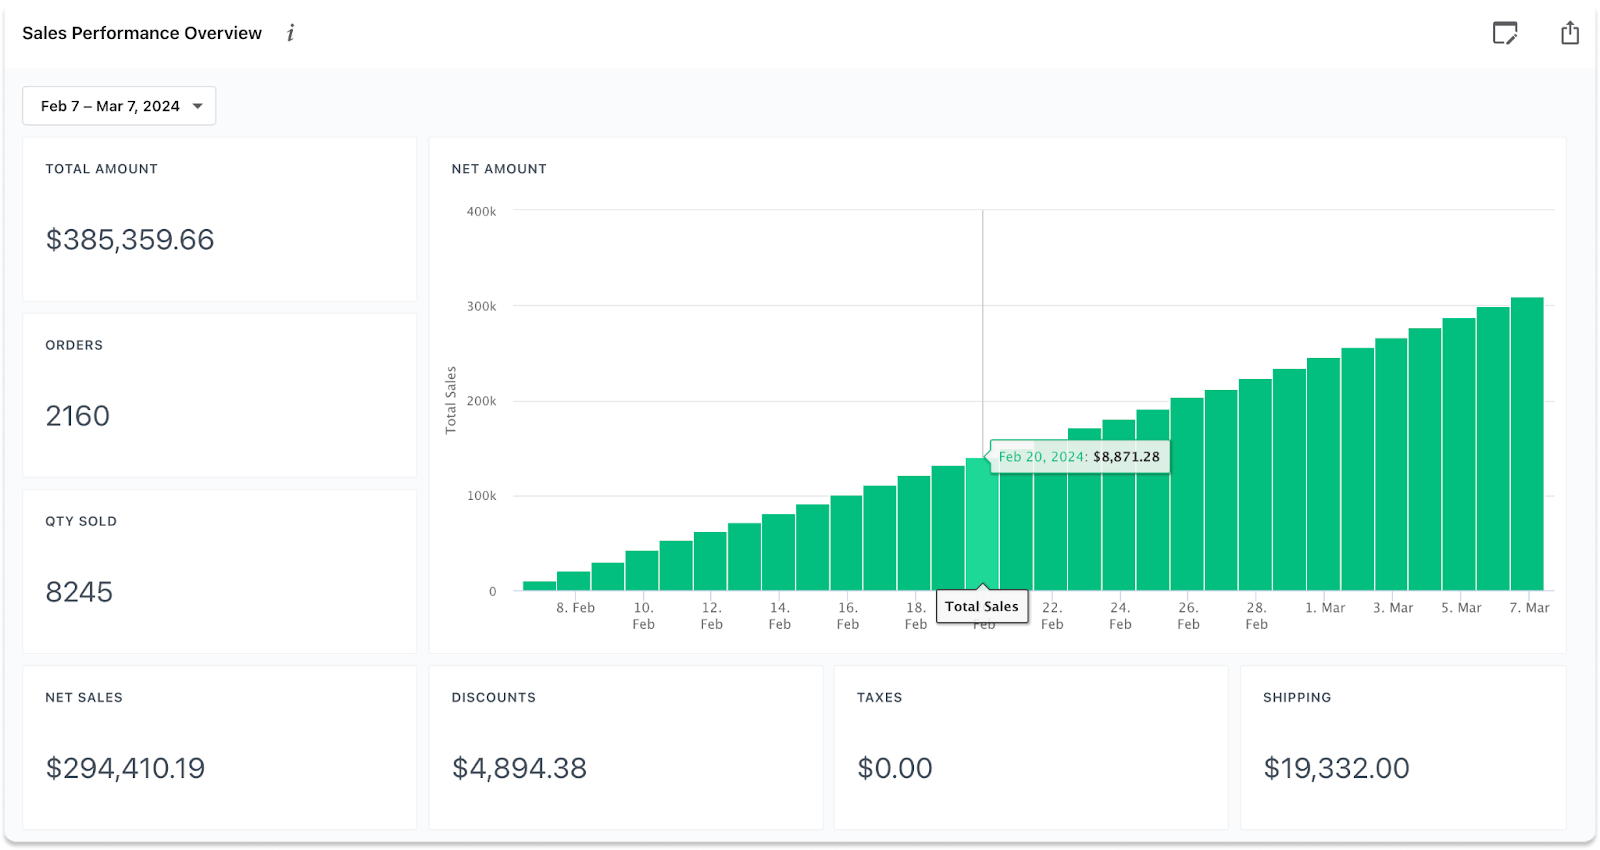
Profitability and cost analysis.
A luxury accessories store uses a dashboard to determine profitability and analyze costs.
Customer lifetime value (CLV).
The company uses a dashboard to determine how much money customers spend on average over the entire subscription period (CLV). It helps tailor loyalty programs and deliver personalized content to increase user loyalty and satisfaction.
Many programs offer dashboard templates that you can edit to suit your needs, making tracking key sales performance metrics easy.
Shopify sales dashboard by Mipler
Shopify dashboards don’t always satisfy users. This is due to customization limitations.
The dashboard may not be very flexible for users with specific analytical needs.
There are also limitations of real-time data: there is a delay in updating the data, which can negatively affect the timeliness of decision-making.
Another problem is that sharing insights can be cumbersome for those who don’t have direct access to the Shopify admin.
Newbies may find the dashboard takes some time to learn.
Shopify sales dashboard from Mipler will be a great solution in this situation.
Here is the basic functionality you will get from Mipler:
Creating custom dashboards on Shopify.
- Add the metrics, graphs, and tables you need with ease.
- Customize your dashboard by editing the layout and choosing the analytics that matters to you.
Using different dashboards for different tasks.
- Add as many dashboards as you need for different purposes, such as sales, product performance, accounting, and customers.
- Create different dashboards with varying templates to your liking.
Data detailing for clarity.
- Pay attention to details, moving from general indicators to specific data.
- Use filters, sorting, and periods to clearly understand your Shopify store.
Compare and analyze with dashboards.
- Compare store activity periods using dashboard templates.
- Change your marketing strategy on Shopify by analyzing the impact of changes in design, sales, and dates on your results.
Frequently asked questions
Is it just big companies that benefit from sales dashboards?
Not at all. Businesses, regardless of their size, find sales dashboards invaluable. Whether you’re a small startup or a growing enterprise, sales dashboards eliminate the need to manually sift through pages of sales records. They present your sales data visually, through charts or tables, enabling you to assess your performance and strategize effectively swiftly.
Why are dashboards important for an eCommerce business?
Dashboards combine critical data from various aspects of e-commerce operations into a single visual interface, providing real-time insights into sales performance, customer behavior, inventory levels, and marketing effectiveness.
What types of data can be tracked with an eCommerce dashboard?
E-commerce dashboards can track a wide range of data, including, but not limited to, sales revenue, average order value, conversion rates, site traffic sources, customer demographics, inventory turnover, product performance, cart abandonment rates, marketing campaign ROI, and customer lifetime value.
How often should I review my eCommerce dashboard?
The frequency of dashboard views depends on the specific metrics being tracked and the pace at which your business is operating. Daily checks may be necessary for high-volume stores or stores with fast inventory movement, while weekly or monthly checks may be sufficient to track broader trends and long-term performance goals.
Do I need technical skills to set up an eCommerce dashboard?
While some dashboard tools require technical expertise, especially for complex data integration, many platforms are designed with user-friendly interfaces that require minimal technical skills. In addition, many tools offer customer support and resources to help users set up dashboards.


I thought you did a great job on this. Although your language is excellent and the picture is enticing, you come across as nervous about what you might be giving next. If you save this walk, I hope you will come back here often.